The ability to manage cash can be the difference between life and death for a company. Exerting control over inflows and outflows with diligently managed accounts payable days is an important practice to keep your business stable, protect the company’s future growth, and maintain employee confidence in the company’s short- and long-term objectives.
Smart cash-flow maintenance also helps to maintain good relationships with suppliers, opening avenues for discounts and easier negotiations. Regardless of industry, having good contacts is the best way to increase investment in your business interests.
Let’s look at the days payable outstanding (DPO)—also known as Accounts Payable days (AP days)—measurement and how it impacts cash flow.
First, let’s review the accounts payable process and how DPO fits in.
Download the free tool: Financial Audit Preparation Checklist
What are accounts payable?
Accounts payable (AP) are accounts in a general ledger that represent a company’s commitment to paying off short-term debts owed to suppliers or creditors after purchasing goods or services on credit instead of with cash up front. The company can acquire what it needs now, and pay suppliers within an agreed-upon time frame (usually Net 30 to 90).
On a balance sheet, accounts payable are listed under the company’s current liabilities, because goods were bought on credit. The debts have to be paid on time to avoid default.
Like any other liability account, accounts payable will have a credit balance. When an account payable is paid, accounts payable will be debited and cash will be credited. The credit balance in accounts payable should be the same amount as the vendor invoices that have been recorded but have yet to be paid.
The AP department in an organization is responsible for tracking and verifying invoices, communicating with suppliers, and making the scheduled payments.
Under the accrual method of accounting, expenses are reported when they are incurred, not when they are paid. The company that receives the goods or services on credit has to report the liability no later than the date they were received. That date is used to record the debit entry to an expense or an asset account.
The accounts payable process
The accounts payable process ensures that the transactions listed in your accounting system are accurate and legitimate. The most important information exists in the following documents:
- Purchase orders issued by the company
- Receiving reports issued by the company
- Invoices from vendors
- Supplier contracts and other agreements
The accounts payable department is responsible for the following monthly activities:
- Processing accurate and legitimate vendor invoices
- Accurate recording in the appropriate general ledger accounts
- The accrual of obligations and expenses that have yet to be completely processed

Financial Audit Preparation Checklist
Financial audits gives companies an objective read of their financial statements. Use this checklist to get started.
What are accounts payable days (days payable outstanding)?
To better keep track of payments, companies can fall back on a reliable formula to help them pay bills and other obligations on time.
Accounts payable days, also known as days payable outstanding (DPO), is a financial ratio that shows the average number of days an organization takes to pay its bills to suppliers.
A low DPO may be considered a healthy DPO, but this isn’t always the case. They can then use the cash they have on hand to make short-term investments, increasing their working capital and freeing up cash flow.
At the same time, a too-high DPO value may signal an inability to pay bills on time. It can indicate a general cash shortfall. Each business should aim for a DPO that best suits its context. If the number of payable days changes, it could indicate that the payment terms with suppliers have changed.
If a company is paying its suppliers quickly, it may mean that the suppliers are demanding fast payment terms, either because short credit terms are part of their business models or because they feel the company is too high a credit risk to allow longer payment terms.
Days payable outstanding formula
Companies calculate DPO by multiplying the average accounts payable (the total of the beginning accounts payable and the ending accounts payable) by the number of days in an accounting period. This formula reveals the total accounts payable turnover.
That number is then divided by the cost of goods sold (COGS). Also known as cost of sales, COGS is the cost of acquiring or manufacturing the products that a company sells during a period. The ratio indicates how well the company manages its cash outflows.
DPO and the cash conversion cycle (CCC)
DPO value plays a role in calculating the cash conversion cycle (CCC). This is a metric that expresses the amount of time that a company takes to convert inventory investments and other resources into cash flow from sales.
While DPO focuses on the company’s current outstanding payables, the CCC (also known as the net operating cycle or simply cash cycle) follows the entire timeline. This extends from when the cash is converted into inventory, expenses, and accounts payable through to sales and accounts receivable, and then back into cash in hand when received.
Public companies reference DPO in their annual financial statements, income statements, and balance sheets.
How DPO is used
A well-run accounts payable process affects every level of a company’s cash position. Paying bills on schedule helps to develop a relationship with suppliers and improves your credit rating. Suppliers may also deliver better privileges, such as higher discounts, in return.
A company’s DPO metric can be used to demonstrate credit worthiness to potential lenders or credit-based suppliers.
It’s important to find the right balance in determining the right number of accounts payable days for your business. We covered the dangers of a higher ratio in the previous section. But keeping DPO low restricts the amount of cash available to reinvest in future opportunities.
In contrast, increasing accounts payable days demonstrates to creditors that the company is not in a position to borrow cash for short-term capital. A weaker company may face liquidity issues.
AP automation technology can help you manage your DPO so you can maximize your working capital while maintaining good vendor relationships.
Firsthand insights from AP automation technology adopters
Whatever the state of your company, having a clear system to pay vendors at the right times is a vital component of any business. Order.co can help companies with tasks such as organizing payment schedules, easily creating informative reports, and tracking payment variances to avoid exceptions and delays.
Order.co also automates the ordering process, freeing up more time for important day-to-day operations. Automated, proactive delivery tracking provides timely updates about the status of your shipments. Customers can complete orders 95% faster than before they began to use Order.co.
Our users have seen transformative effects on their businesses since they started using Order.co. These organizations are using our automation to streamline their processes, speed up order fulfillment, and optimize supply spending.
Here are a few case studies:
Zerocater
Before implementing Order.co, Zerocater needed one or two business days a month just to record payments and manage invoices. With our platform in place, the number of invoices they needed to complete decreased considerably—from 200 invoice payments to Amazon each month to just three or four. This reduction made it easier to track spending and wade through the ordering process. (More than 80% of our clients pay just one invoice per week or month.)
The Zerocater team also took advantage of Order’s real-time analytics features to add substantial visibility to their budgets. Their managers can see where every dollar goes and handle issues proactively.
SoulCycle
In their previous system, managers at SoulCycle had to jump through several unnecessary hoops to complete transactions. Each vendor site had its own rules and logins to keep track of. Users had to manually track transactions and its effect on their monthly budgets. This made payment reconciliation a long and challenging process.
Once the company began using Order.co, everything changed. Orders were fulfilled faster since employees could place orders from one approved catalog into one cart shared across every vendor. Reporting on expenses went from a five to six-hour monthly exercise to a fast single payment with one consolidated invoice.
Financial Audit Preparation Checklist
Financial audits gives companies an objective read of their financial statements. Use this checklist to get started.
"*" indicates required fields
BLANKSPACES
BLANKSPACES’ purchasing process was time-consuming, disjointed, and difficult to parse. Each month, purchases went unrecorded. Miscommunications between locations were common. But after working with Order.co, the purchasing workflow became simpler in a matter of minutes.
Acquiring supplies became much more cost-effective. The pre-established vendor network included with Order.co made setting up accounts payable schedules a breeze. In the words of facilities manager Elizabeth Nowlin, “Once we’ve added a product to Order.co, we know everything has been taken care of.”
Visibility and process are the first critical steps in attaining a successful DPO. By implementing a software system, you can optimize the procure to pay process and keep cash flow in check. To learn more about using Order.co to streamline your most important AP tasks, request a demo.
Get started
Schedule a demo to see how Order.co can simplify buying for your business.
"*" indicates required fields
Having the right financial professionals on your team is critical to securing your company’s bottom line. After all, these are the people responsible for managing your accounts payable ledger and future planning, as well as optimizing your budgets by aligning spending, curbing fraud, and eliminating maverick spending that harms your profitability.
Spend analysis is a method the best financial professionals use to examine their companies’ core financial operations and maintain long-term financial health.
This type of analysis shows organizations how they spend their money on products, materials, and services. It allows finance and procurement teams to identify their primary expenses and purchases.
Download the free ebook: How to Show Your CFO You're Saving Money
With this data, firms make better forecasts, ensure budgetary compliance, and improve their financial performance.
Does your business need a comprehensive process to optimize and track the budget and control maverick spend? In this guide, you’ll learn several ways your business or procurement department can conduct a spend analysis of your accounts payable ledger.
In this article, we’ll discuss:
- How to define accounts payable (AP) spend analysis of general ledger (GL) balances
- The top four benefits of spend analysis for businesses
- How to conduct a seven-step spend analysis process
What is an accounts payable spend analysis of general ledger balances?
An accounts payable spend analysis is a critical process within strategic sourcing. AP spend analysis helps companies improve their financial processes by:
- Reviewing payment, purchasing, and spending practices
- Gaining clarity into the organization’s overall cash flow
- Improving efficiency and optimizing buying power
- Managing long-term risks and enforcing contract compliance
- Reviewing budget and forecasting needs
- Tracking income statements and account balances
Accounts payable ledgers explained
An accounts payable (AP) ledger, sometimes called a creditors’ ledger, shows the past transactions between a company and its suppliers. It includes information such as amounts owed, dates, and other details relevant to the repayment of short-term liabilities.
Compiling an AP ledger brings together all available vendor payment information in one place. This makes it easy to track all your creditor payments, due dates, and associated information. The ledger also acts as a budgetary control tool that compares to the general ledger for accuracy. This is a dual control process, where one employee enters transactions and another employee checks for issues or errors.

How to Show Your CFO You're Saving Money
Learn how to work in coordination with your CFO to drive operational efficiency and reduce costs.
4 Benefits of spend analysis
Spend analysis provides businesses with a qualitative advantage over their competitors. For this reason, nearly 60% of organizations are considering using advanced and predictive analytics in their practices.
Many of these companies cite the following benefits from analyzing their spending data:
1. Increased spend visibility
Spend visibility is more than tracking company spending. It is a detailed analysis that provides insights into how money travels through the business. It also helps companies identify suspicious activity or fraud.
Spend analysis provides a full history of how an organization spends each dollar during the entire purchase cycle, from sourcing to payment. For instance, if you hire a construction contractor for your company, detailed transaction reporting will identify the employee that approved the quote.
2. Identifying outstanding saving opportunities
Spend analysis identifies new opportunities to reduce companies’ total budgetary costs. The data they receive allows financial professionals to understand spending at the line-item level and develop a pipeline to optimize that spending.
This analysis can also create or capture value through process optimization, where the procure-to-pay process is automated to reduce invoice and purchase order life cycles. This improves supplier relationship management and increases productivity, accuracy, and cost reductions.
An enterprise-level platform helps companies conduct spend analyses to track their cash flow and save money. Xpres Spa, an airport spa destination, says that Order.co’s software has helped the company save 9.6% on its products while simplifying delivery to airports.
“From our first meeting in spring 2016 to now, Order.co has helped us find savings and solutions to match ever-increasing demand,” said Tesh Ramsarup, Director of Operation Services for Xpres Spa. “The knowledge gained over the past three years has allowed us to make decisive choices to provide our people with the best tools and our customers with exceptional service—all while being conscientious of spending.”
You can read the entire case study here.
3. Superior spend forecasting models
Spend analysis constructs better forecasting models that predict ways businesses can take advantage of savings in future quarters.
Spend forecasting integrates historical data analysis with market intelligence and forecasting trends from various sources. It provides decision-makers with reliable insights they can use to optimize their supply chain, slash costs, and make strategic spending decisions. This enables companies to optimize profits and attain a market advantage.
In the past, financial teams created their spend forecasting models manually—they combined months of analysis to identify cost-cutting strategies. Unfortunately, many opportunities expired before they could capitalize on them.
The digital era provides real-time descriptive analytics (analysis of historical data). Companies use descriptive analytics to identify patterns they can leverage to create steady forecasting models and improve their financial performance. With holistic data categorization, simplified trend analysis, and improved spend forecasting methods, organizations build reliable spend data performance sets from specified periods.
4. Ability to track diversity reporting
When spending data is organized into a centralized platform, a wealth of data becomes available for analysis and action. Diversity is one such category. By identifying and collecting diversity information from current supplier relationships, businesses can examine and improve their diversity numbers across all accounts. This data both informs future spending and helps businesses communicate the positive impacts of their strategic partnerships.
How to Show Your CFO You're Saving Money
Learn how to work in coordination with your CFO to drive operational efficiency and reduce costs.
"*" indicates required fields
How to conduct a spend analysis process of your accounts payable ledger
Now that you know why a spend analysis is critical, we’ll walk you through completing a spend analysis at your company. Here are seven steps to get you started:
1. Use the right accounting system to conduct a spend analysis
Your finance team should have the tools they need to do a comprehensive spend analysis of your financial statements.
You’ll recognize the right accounting system tool when it offers these advantages:
- Contract management improves because the tool extracts insights from actual data and journal entries instead of only from forecasted pricing and vendor performance benchmarks.
- Supplier relationships are efficient and strategic. Software like Order.co monitors vendor balances, tracks merchandise inventory, eliminates redundant relationships, and shifts your focus to shared economic opportunities.
- The tool offers insights for reducing waste, increasing efficiency, and lowering procurement costs. At the same time, it improves general cost reduction initiatives across your entire organization. Ultimately, you will be able to increase the value of your company assets at a lower cost and strengthen your bottom line.
- Indirect spend, ad hoc spend, payable balances, and project-based budgets integrate into your spend data for analysis.
Accounting software is designed to help your organization view all your spend data in one place for easier access and better analysis.
For example, NY Kids Club uses the Order.co platform to manage and control all their spend analysis, journal entries, and balance sheets.
2. Define your objectives
The next step for your AP spend analysis process is to define your objectives. Clear goals make data gathering and analysis efforts easier. Here are some common objectives to follow during your spend analysis:
- Understand your spend at a basic level, including your cash flow, debt amounts, and current liabilities, so your team can identify savings opportunities
- Track key vendors so your finance team or procurement office can define and execute a strategic vendor plan
- Discover key spend areas that affect your earnings before interest, taxes, depreciation, and amortization (EBITDA)—including COGS (cost of goods sold) and SG&A (sales, general, and administrative)
3. Identify all spend data sources
Next, create an inventory of all the systems where your spend data lives, including payable journals, payable subsidiary ledgers, and general ledger accounts. This should include all your departments, accounts payable, general ledger, p-cards, credit cards, and eprocurement system.
This step will help AP capture all your spend data for analysis. If your business has separate business units, locations, or verticals, you’ll likely have to integrate multiple channels.
Take care to create uniformity in your data sources throughout the next steps. Without uniformity across your organization, data integrity is easily compromised. For example, inconsistency in coding materials or describing products ordered can make it difficult to accurately analyze that data later on.
A simple inventory table should capture the total amount of data in subsidiary ledgers and may include the following data sets:
- System name
- Business units
- Type of spend
An effective software platform helps your company keep internal control of your data from subsidiary ledgers, general ledger accounts, income statements, and a variety of bookkeeping sources.
4. Create a spend category tree
Next, establish a spend category tree. This tree can span continents, cost centers, functions, organizational belongings, and responsibilities. Since you’re pulling data from multiple systems, you will probably have different fieldsets.
Identify the data you want to capture. Then use a shared schema to capture what that data means. This step will ensure the information gathered across data sources adheres to a unified standard for analysis.
Most enterprise resource planning (ERP) systems use unified methods to categorize spending transactions into buckets. The most common approach used is a general ledger chart of accounts. You can also use your own in-house or industry-specific schema if that fits your purpose better.
Here are two additional standard schema classification options:
- United Nations Standard Products and Services Code (UNSPSC): This global, open standard is an efficient way to classify your products and services. It is free to browse and download in PDF form. You can also download alternative formats from the UNSPSC website for $100.
- North American Industry Classification Schema (NAICS): Federal agencies use this code to classify businesses. It’s the primary classification schema system used by the US government for reporting statistics.
5. Identify and extract data
Extract the spend data from all your ledgers. For instance, pull data from your subsidiary ledger, general ledger, and accounts payable ledger via your ERP system.
You can also draw this data from your company’s invoice management system. This should include all invoices and invoice rows associated with supplier information, dates, totals, currency, accounts, and cost centers. Your accounts payable process should capture all this information on invoices down to the item level.
6. Cleanse your data
Cleanse, correct, and standardize the data in your accounts payable ledger. Fix any misspelled item or supplier names. Also, eliminate any duplicates and manage errors in your supplier list. This step will help you better control accounts in your AP departments.
7. Categorize your purchases
Categorize your AP data. Classify all information starting on the account level.
Next, analyze your suppliers. Depending on how you’ve constructed your spend category tree, suppliers may fit into one or several categories.
Create categories for invoice numbers, vendor accounts, vendor balances, and income statements. Pay attention to whether suppliers belong to multiple categories.
Use Order.co to simplify accounts payable spend analysis
Businesses that conduct spend analyses have a distinct advantage over their competitors—they see improved spend visibility, cash flow, and vendor relationships. Spend analysis produces superior forecasting models and diversity reports.
Before starting a spend analysis, select a reliable accounting platform. It will help your finance team conduct a thorough, error-free analysis. Choose software that will cover all the bases:
- Buying and approving products
- Setting budgets for each accounting period
- Enforcing approvals by user, location, product, and category
- Providing real-time analytics for actionable purchasing insights
A platform like Order.co enables your finance team to conduct a spend analysis that tracks your spend and saves you money.
For more information on using data and technology to drive business growth, download our complimentary ebook, “Creating a Growth Machine.”
Get started
Schedule a demo to see how Order.co can simplify buying for your business.
"*" indicates required fields
When it comes to your company’s financial health, revisiting the basics can bring new perspectives to current problems. Consider a sports analogy:What do the world’s most famous coaches make their players do in the off season? Practice the fundamentals. Coaches have their teams practice rookie-level drills because it trains their minds and bodies to react with cat-like reflexes. They solidify the fundamentals to the point they're instinctual.
The same concept applies to any profession, whether you’re a novice or an expert. Even if you know the fundamentals, there is a reason for the adage, ‘Use it or lose it.’
That is why we are going back to the basics in this article to re-examine T-accounts.
Download the free tool: Financial Audit Preparation Checklist
What is an accounts payable T-account?
A T-account is named for the visual presentation of double-entry bookkeeping. The left side of the ‘T’ is where a debit is recorded in the general ledger, and the right side is for credits. Each account — whether it’s accounts payable, accounts receivable, payroll, assets, etc. — will have its own T-account setup. The account title sits above the top bar of the ‘T.’
In double-entry bookkeeping, each accounting entry affects at least two of the company’s accounts. When a debit is entered onto the left side of one account, it sends a credit to the right side of another account. The reverse is also true. If you enter a transaction on the credit side in one account, there will be a corresponding entry on the debit side of another account. In this way, debits and credits increase or decrease the corresponding accounts to keep the books balanced.
Financial Audit Preparation Checklist
Financial audits gives companies an objective read of their financial statements. Use this checklist to get started.
Examples of accounts payable T-account
T-accounts are a useful visual representation of many types of balance activities. Some common types of T-account representations are:
Assets: Cash transactions, accounts receivable, physical inventory, hard assets like furniture, or technical assets such as computers and phones
Liabilities: Accounts payable, loans, and notes payable
Revenue: Receipt of payment from customers for goods or services
Expenses: Costs incurred to run the business such as rent, supplies, insurance coverage, incidentals, travel, and utilities
Equity: The conversion of company funds into financial instruments, such as shares sold as part of employee stock purchase plans (ESPP) or incentive shares
T-Accounts and their role in accounting systems
The most common method for bookkeeping is the double-entry accounting system of T-accounts. For the balance sheet to be balanced, a business transaction entered into the system must take away from one account and add the same amount to another and vice versa. The most common reason for balance sheet discrepancies is a ledger account entry erroneously placed on the debit side or credit side of the wrong account.
The idea of an accounts payable T-account gets a little confusing for even the most seasoned professional bookkeepers. When using a T-account, you must ensure the correct figure is applied to the correct side of the ‘T.’ It’s common to think of a debit entry as a subtraction to an account and a credit entry as an addition to an account. But this is not always the case:
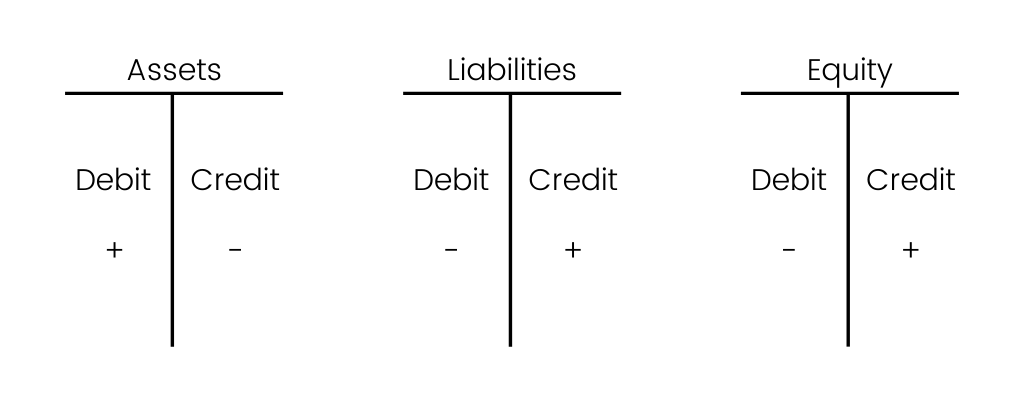
- Entering a debit (left side) transaction to cash accounts, accounts receivable, or asset accounts like inventory and PP&E increases the account. When you enter a credit (right side) into these accounts, it decreases the amount.
- For the liabilities or shareholders’ equity accounts, debit entry decreases the amount and a credit increases it.
- Income statements also rely on the accuracy of the accounts payable T-account journal entry to reflect accurate figures.
- Accounts that track expense accounts, revenue accounts, gains, and losses use the debit/credit method in the same way as accounts receivable. A debit transaction increases the revenue accounts and a credit entry decreases it. Conversely, a debit will decrease the amount for expense accounts, whereas a credit will increase it.
Case in point: If your business issues common stock, you debit the cash account and credit the shareholders’ equity account to reflect this. But if an employee leaves before their shares are fully vested, they forfeit their shares and you record it as a debit to the shareholder’s equity account and a credit to the cash account.
How do AP T-accounts help spend management?
T-accounts allow a business to easily track its spending. You can see journal entries over a given period of time and view business transactions. But a T-account doesn’t necessarily help your business make wise decisions regarding managing its spending intelligently.
Accounting software tracks your company’s balance sheet and income statements. But it can only give you dynamic figures that provide superficial insight into ways to improve spend management.
The biggest problem with every fast-paced business is identifying areas that are leaking cash unnecessarily. Obvious signs in your financial statements — such as the accounts payable figure being much higher than the accounts receivable — stand out. But without 100% visibility into your spend management, you’ll be left high and dry on how to curb your spending. Worse yet, you may find some balances inflated or deflated, painting a picture that may not reflect reality. Working capital, cash flow, and your bank account suffer as a result.
Financial Audit Preparation Checklist
Financial audits gives companies an objective read of their financial statements. Use this checklist to get started.
"*" indicates required fields
Streamlining accounts payable
Streamlining your accounts payable and accounts receivable processes may sound like a daunting task, especially when you work with a significant number of vendors. But eliminating maverick spend means finding ways to gain clarity on your company’s balance sheet. Simplifying your procurement process across different accounts with vendors is the first step toward reducing the time spent on the short-term process. This will significantly reduce money spent in the long term.
To help you understand what we mean, let’s take a look at the story of one of our customers, [solidcore]. As a health and wellness company, [solidcore] was expanding quickly with increasing demand for their products and services. In one year, they doubled the number of locations from 25 to 50. With such explosive growth comes a lot of chaos if you’re not properly prepared.
At first, [solidcore] held multiple accounts across multiple vendors and multiple users. Spend tracking was chaotic. The accounts payable department recorded receipts in the general ledger one by one, leading to a backlog. Without a proper purchasing management system, company executives couldn’t get real-time, accurate data on their cash flow, current assets, and expense accounts.
Since implementing Order.co, [solidcore] streamlined a process that once took at least two days and tons of back-and-forth emails for its 25 locations. Today, the process takes about four hours across all 50 locations. Now [solidcore] can see their spending at the product, location, and aggregate levels. With standardized processes steadily implemented in a more reliable manner, the company has much more transparency in its working capital and bank account balance than ever before.
Since implementing Order.co, [solidcore] streamlined a process that once took at least two days and tons of back-and-forth on emails for 25 locations. Today, the process only takes about four hours across all 50 locations.
Use Order.co to streamline accounts payable
Whether refining the fundamentals or digging deep to find innovative ways to streamline your accounts payable process, expertise requires your eyes to stay on the prize—but on potential hindrances, too. The figures on your company’s financial statements tell only a small part of the story even though they reflect the bigger picture.
Using the Order.co platform, many basic tasks such as reporting and visualization, invoice reconciliation, and spend analysis happen automatically within the platform. It takes the guesswork out of managing spending across locations and gives accounting professionals granular insight into every dollar flowing into and out of the organization.
Order.co offers growing businesses the most comprehensive and user-friendly accounts payable management & automation available. We invite you to request a free demo to learn more.
Get started
Schedule a demo to see how Order.co can simplify buying for your business.
"*" indicates required fields